2  Customer Spending Analysis

2.1 Data Overview

str(ecomdata)
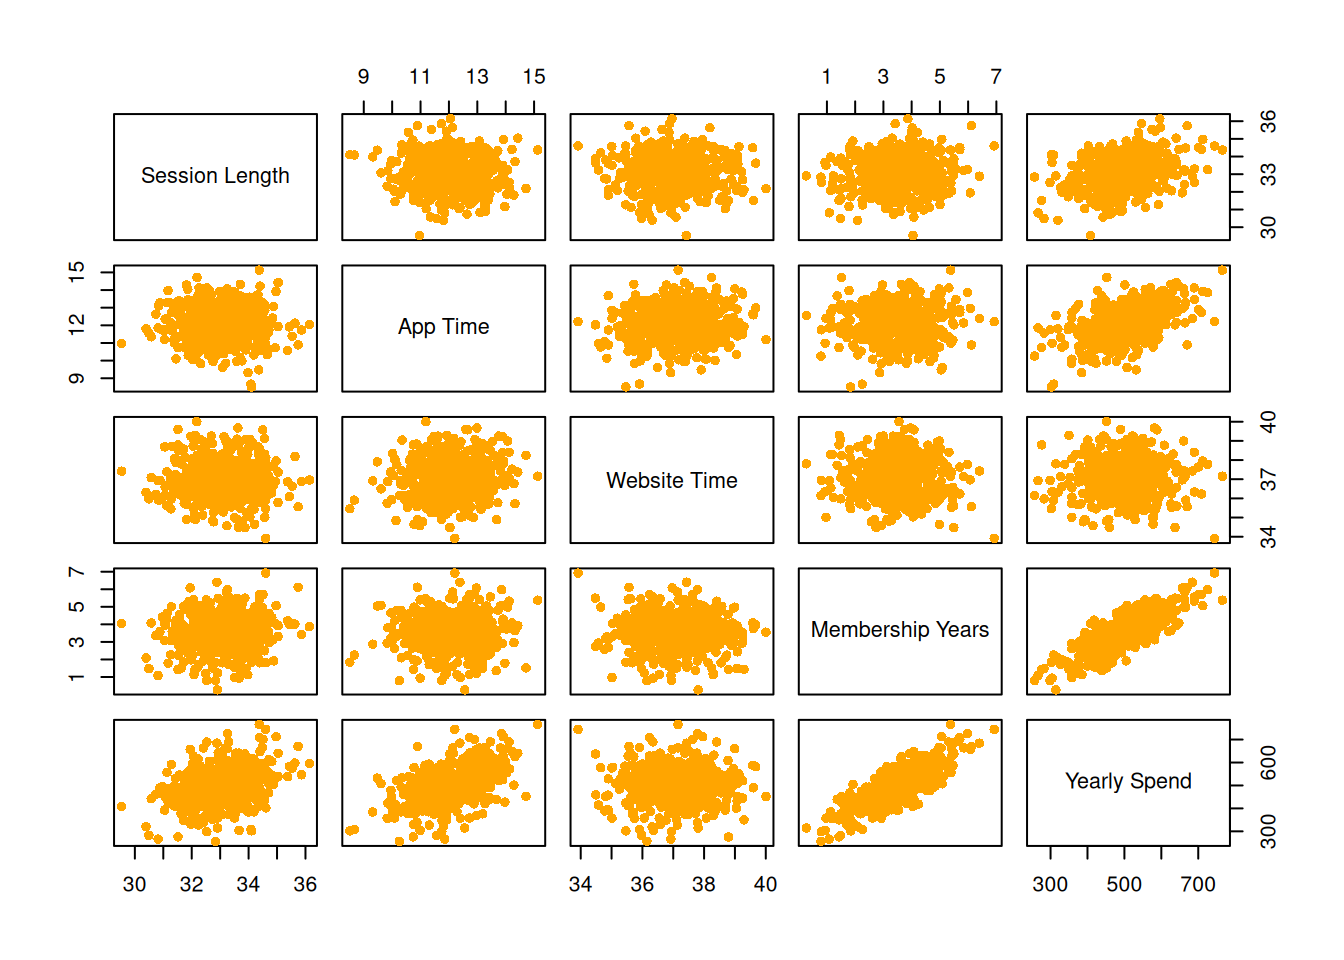
'data.frame':   500 obs. of  8 variables:
 $ Email               : chr  "mstephenson@fernandez.com" "hduke@hotmail.com" "pallen@yahoo.com" "riverarebecca@gmail.com" ...
 $ Address             : chr  "835 Frank Tunnel\nWrightmouth, MI 82180-9605" "4547 Archer Common\nDiazchester, CA 06566-8576" "24645 Valerie Unions Suite 582\nCobbborough, DC 99414-7564" "1414 David Throughway\nPort Jason, OH 22070-1220" ...
 $ Avatar              : chr  "Violet" "DarkGreen" "Bisque" "SaddleBrown" ...
 $ Avg..Session.Length : num  34.5 31.9 33 34.3 33.3 ...
 $ Time.on.App         : num  12.7 11.1 11.3 13.7 12.8 ...
 $ Time.on.Website     : num  39.6 37.3 37.1 36.7 37.5 ...
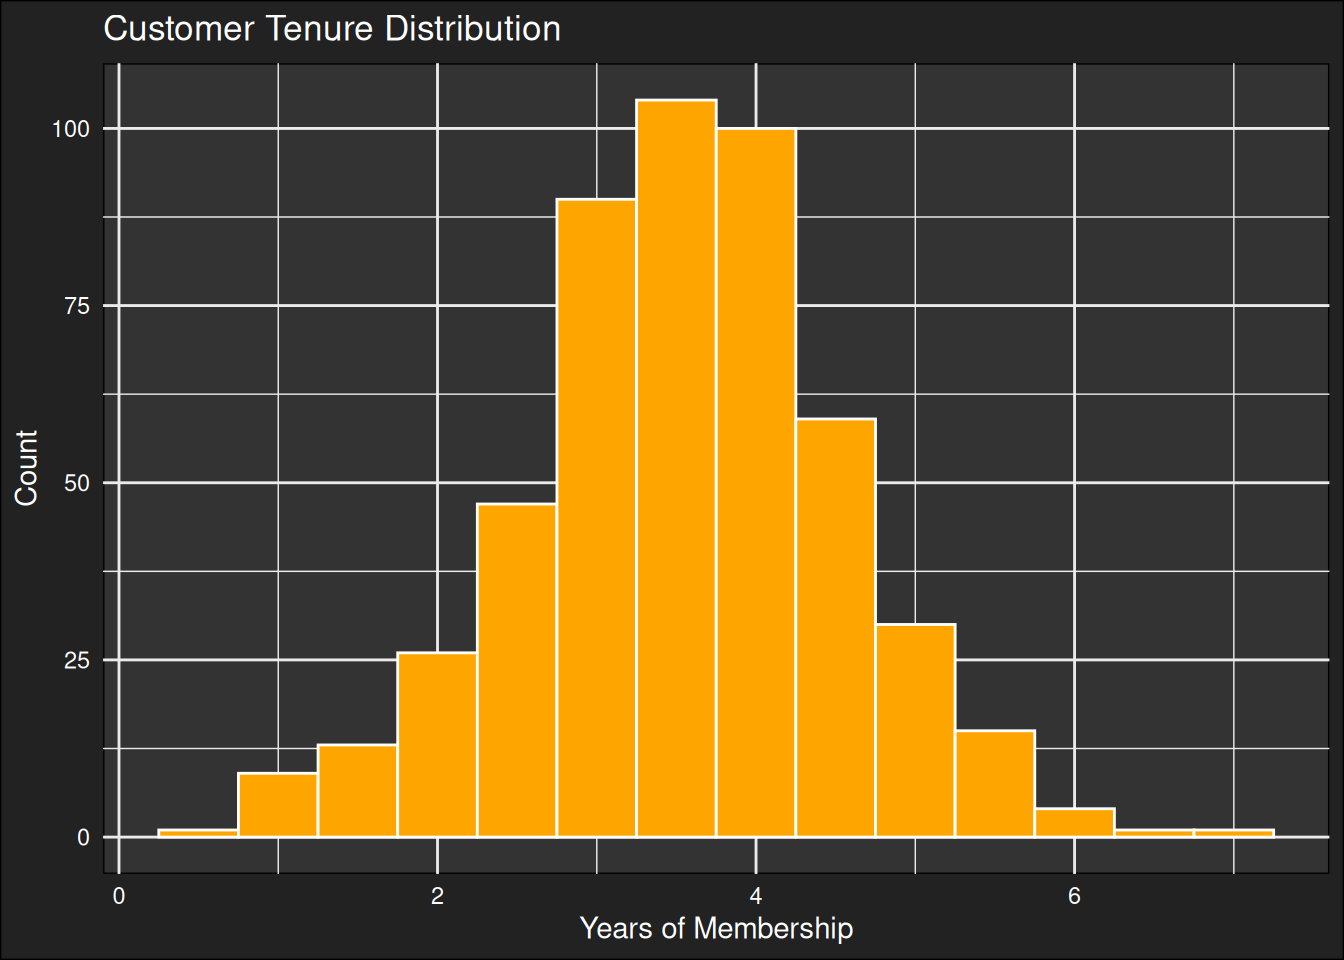
 $ Length.of.Membership: num  4.08 2.66 4.1 3.12 4.45 ...
 $ Yearly.Amount.Spent : num  588 392 488 582 599 ...
summary(ecomdata)
    Email             Address             Avatar          Avg..Session.Length
 Length:500         Length:500         Length:500         Min.   :29.53      
 Class :character   Class :character   Class :character   1st Qu.:32.34      
 Mode  :character   Mode  :character   Mode  :character   Median :33.08      
                                                          Mean   :33.05      
                                                          3rd Qu.:33.71      
                                                          Max.   :36.14      
  Time.on.App     Time.on.Website Length.of.Membership Yearly.Amount.Spent
 Min.   : 8.508   Min.   :33.91   Min.   :0.2699       Min.   :256.7      
 1st Qu.:11.388   1st Qu.:36.35   1st Qu.:2.9304       1st Qu.:445.0      
 Median :11.983   Median :37.07   Median :3.5340       Median :498.9      
 Mean   :12.052   Mean   :37.06   Mean   :3.5335       Mean   :499.3      
 3rd Qu.:12.754   3rd Qu.:37.72   3rd Qu.:4.1265       3rd Qu.:549.3      
 Max.   :15.127   Max.   :40.01   Max.   :6.9227       Max.   :765.5      

2.2 Spending Patterns

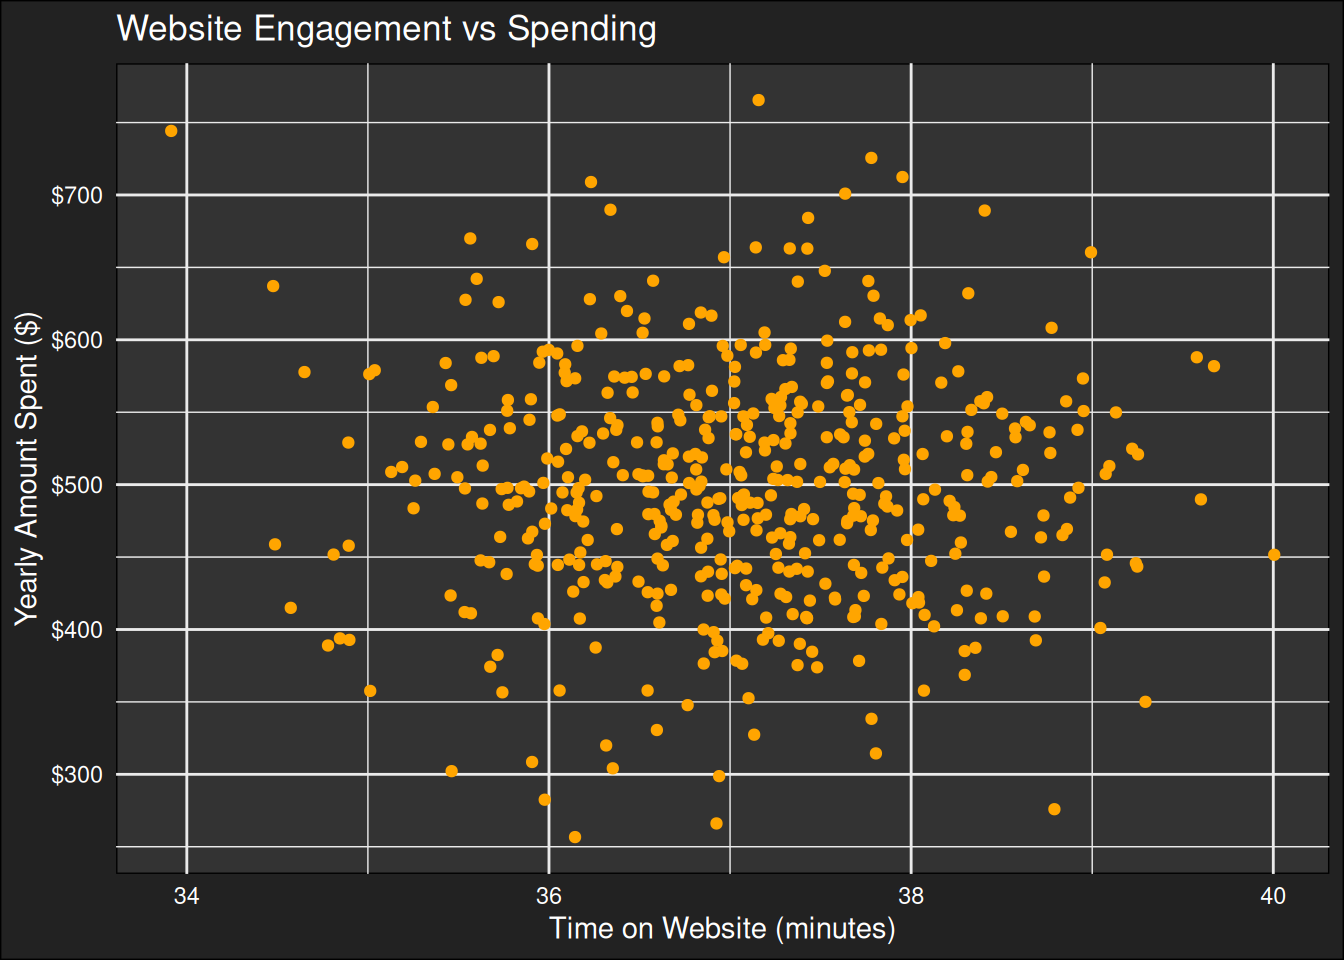
ggplot(ecomdata, aes(x=Time.on.Website, y=Yearly.Amount.Spent)) + 
  geom_point(color="orange") + 
  labs(title = "Website Engagement vs Spending",
       x = "Time on Website (minutes)",
       y = "Yearly Amount Spent ($)") +
  scale_y_continuous(labels = dollar)

Time on website vs spending
ggplot(ecomdata, aes(x=Avg..Session.Length, y=Yearly.Amount.Spent)) + 
  geom_point(color="orange") +
  labs(title = "Session Length vs Spending",
       x = "Average Session Length (minutes)",
       y = "Yearly Amount Spent ($)") +
  scale_y_continuous(labels = dollar)

Session length vs spending

2.3 Variable Relationships

pairs(ecomdata[c("Avg..Session.Length", "Time.on.App", "Time.on.Website",
                "Length.of.Membership", "Yearly.Amount.Spent")],
      col = "orange",
      pch = 16,
      labels = c("Session Length", "App Time", "Website Time",
                "Membership Years", "Yearly Spend"))

Pairwise relationships

2.4 Membership Analysis

ggplot(ecomdata, aes(x=Length.of.Membership)) + 
  geom_histogram(fill="orange", color="white", binwidth=0.5) +
  labs(title = "Customer Tenure Distribution",
       x = "Years of Membership",
       y = "Count")

Membership duration

2.5 Predictive Modeling

lm.fit <- lm(Yearly.Amount.Spent ~ Length.of.Membership, data=ecomdata)
summary(lm.fit)

Call:
lm(formula = Yearly.Amount.Spent ~ Length.of.Membership, data = ecomdata)

Residuals:
     Min       1Q   Median       3Q      Max 
-125.975  -29.032   -0.494   33.033  147.777 

Coefficients:
                     Estimate Std. Error t value Pr(>|t|)    
(Intercept)           272.400      7.675   35.49   <2e-16 ***
Length.of.Membership   64.219      2.090   30.72   <2e-16 ***
---
Signif. codes:  0 '***' 0.001 '**' 0.01 '*' 0.05 '.' 0.1 ' ' 1

Residual standard error: 46.66 on 498 degrees of freedom
Multiple R-squared:  0.6546,    Adjusted R-squared:  0.6539 
F-statistic: 943.9 on 1 and 498 DF,  p-value: < 2.2e-16
ggplot(ecomdata, aes(x=Length.of.Membership, y=Yearly.Amount.Spent)) + 
  geom_point(color="orange", alpha=0.5) +
  geom_smooth(method="lm", color="red") +
  labs(title = "Membership Duration Predicts Spending",
       x = "Years of Membership",
       y = "Annual Spending ($)") +
  scale_y_continuous(labels = dollar)
`geom_smooth()` using formula = 'y ~ x'

Regression line

2.6 Model Validation

set.seed(1)
train_idx <- sample(1:nrow(ecomdata), 0.8*nrow(ecomdata))
train <- ecomdata[train_idx,]
test <- ecomdata[-train_idx,]

model <- lm(Yearly.Amount.Spent ~ Length.of.Membership, data=train)
preds <- predict(model, test)
errors <- preds - test$Yearly.Amount.Spent

metrics <- data.frame(
  RMSE = sqrt(mean(errors^2)),
  MAPE = mean(abs(errors/test$Yearly.Amount.Spent)),
  R2 = summary(model)$r.squared
)

kable(metrics, caption = "Model Performance")
Model Performance
RMSE MAPE R2
44.78106 0.0769213 0.6503268

2.7 Conclusions

Based on the analysis of the e-commerce customer data, we can draw the following key insights:

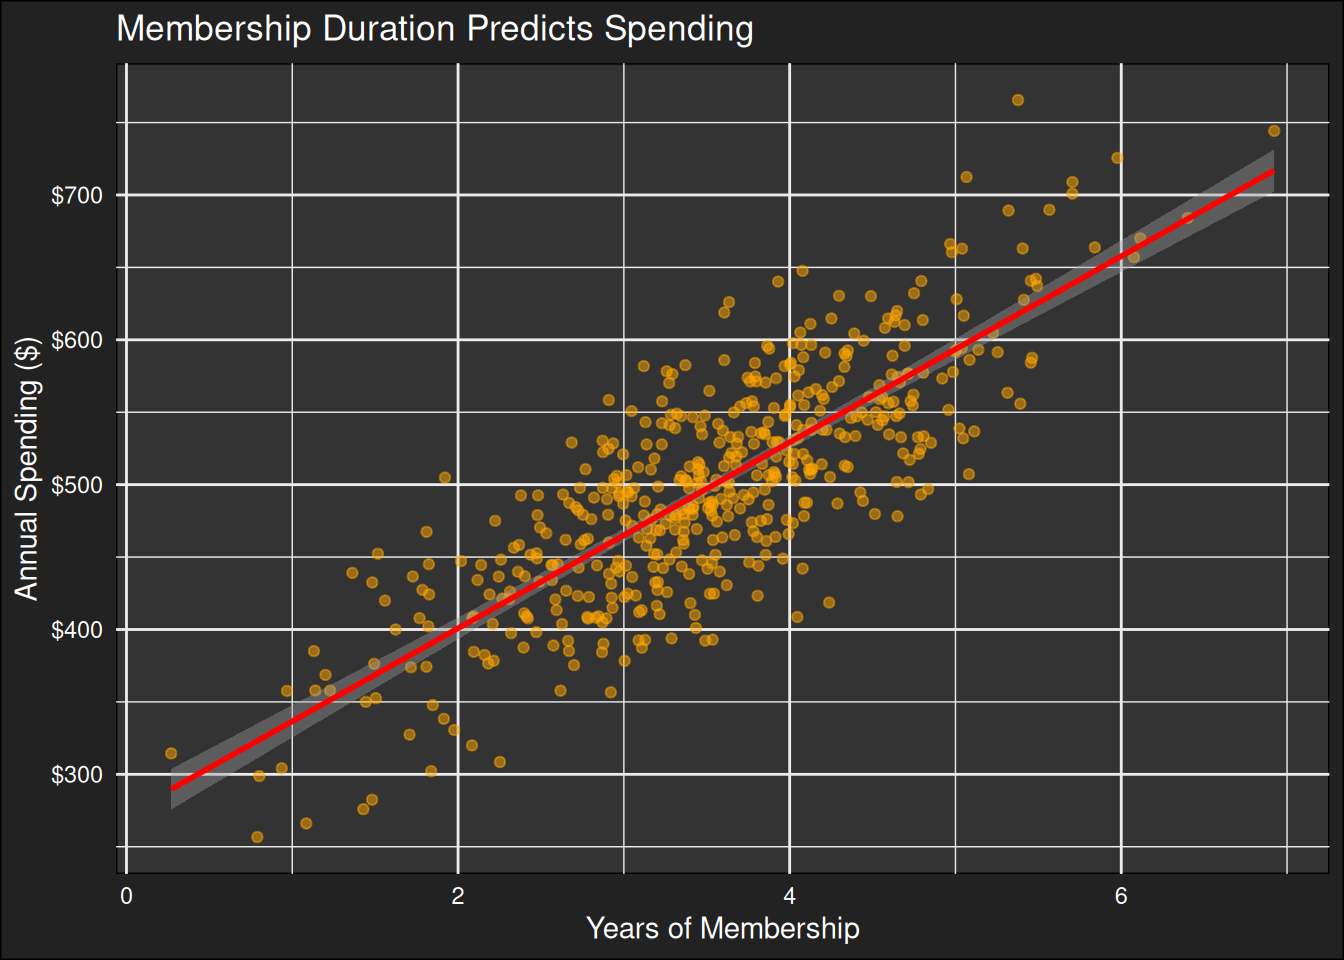
  1. Membership Duration: The strongest predictor of customer behavior is the length of their membership. Specifically, for every year of membership, the model indicates a coefficient of 64.2 years, suggesting that longer membership durations correlate with higher engagement or purchases.

  2. Model Performance: The linear regression model explains 65.5% of the variance in customer behavior. This indicates that the model provides a fairly strong fit, capturing a significant portion of the factors influencing customer actions.

These findings provide valuable insights that can guide e-commerce platforms in identifying key customer segments and tailoring strategies to enhance customer retention and engagement.